What gets counted counts and Introduction to
R and RStudio
![]()
- R is an open-source statistical programming language
- R is also an environment for statistical computing and graphics
- It’s easily extensible with packages
![]()
- RStudio is a convenient interface for R called an IDE (integrated development environment), e.g. “I write R code in the RStudio IDE”
- RStudio is not a requirement for programming with R, but it’s very commonly used by R programmers, data scientists, economists, data journalists and others
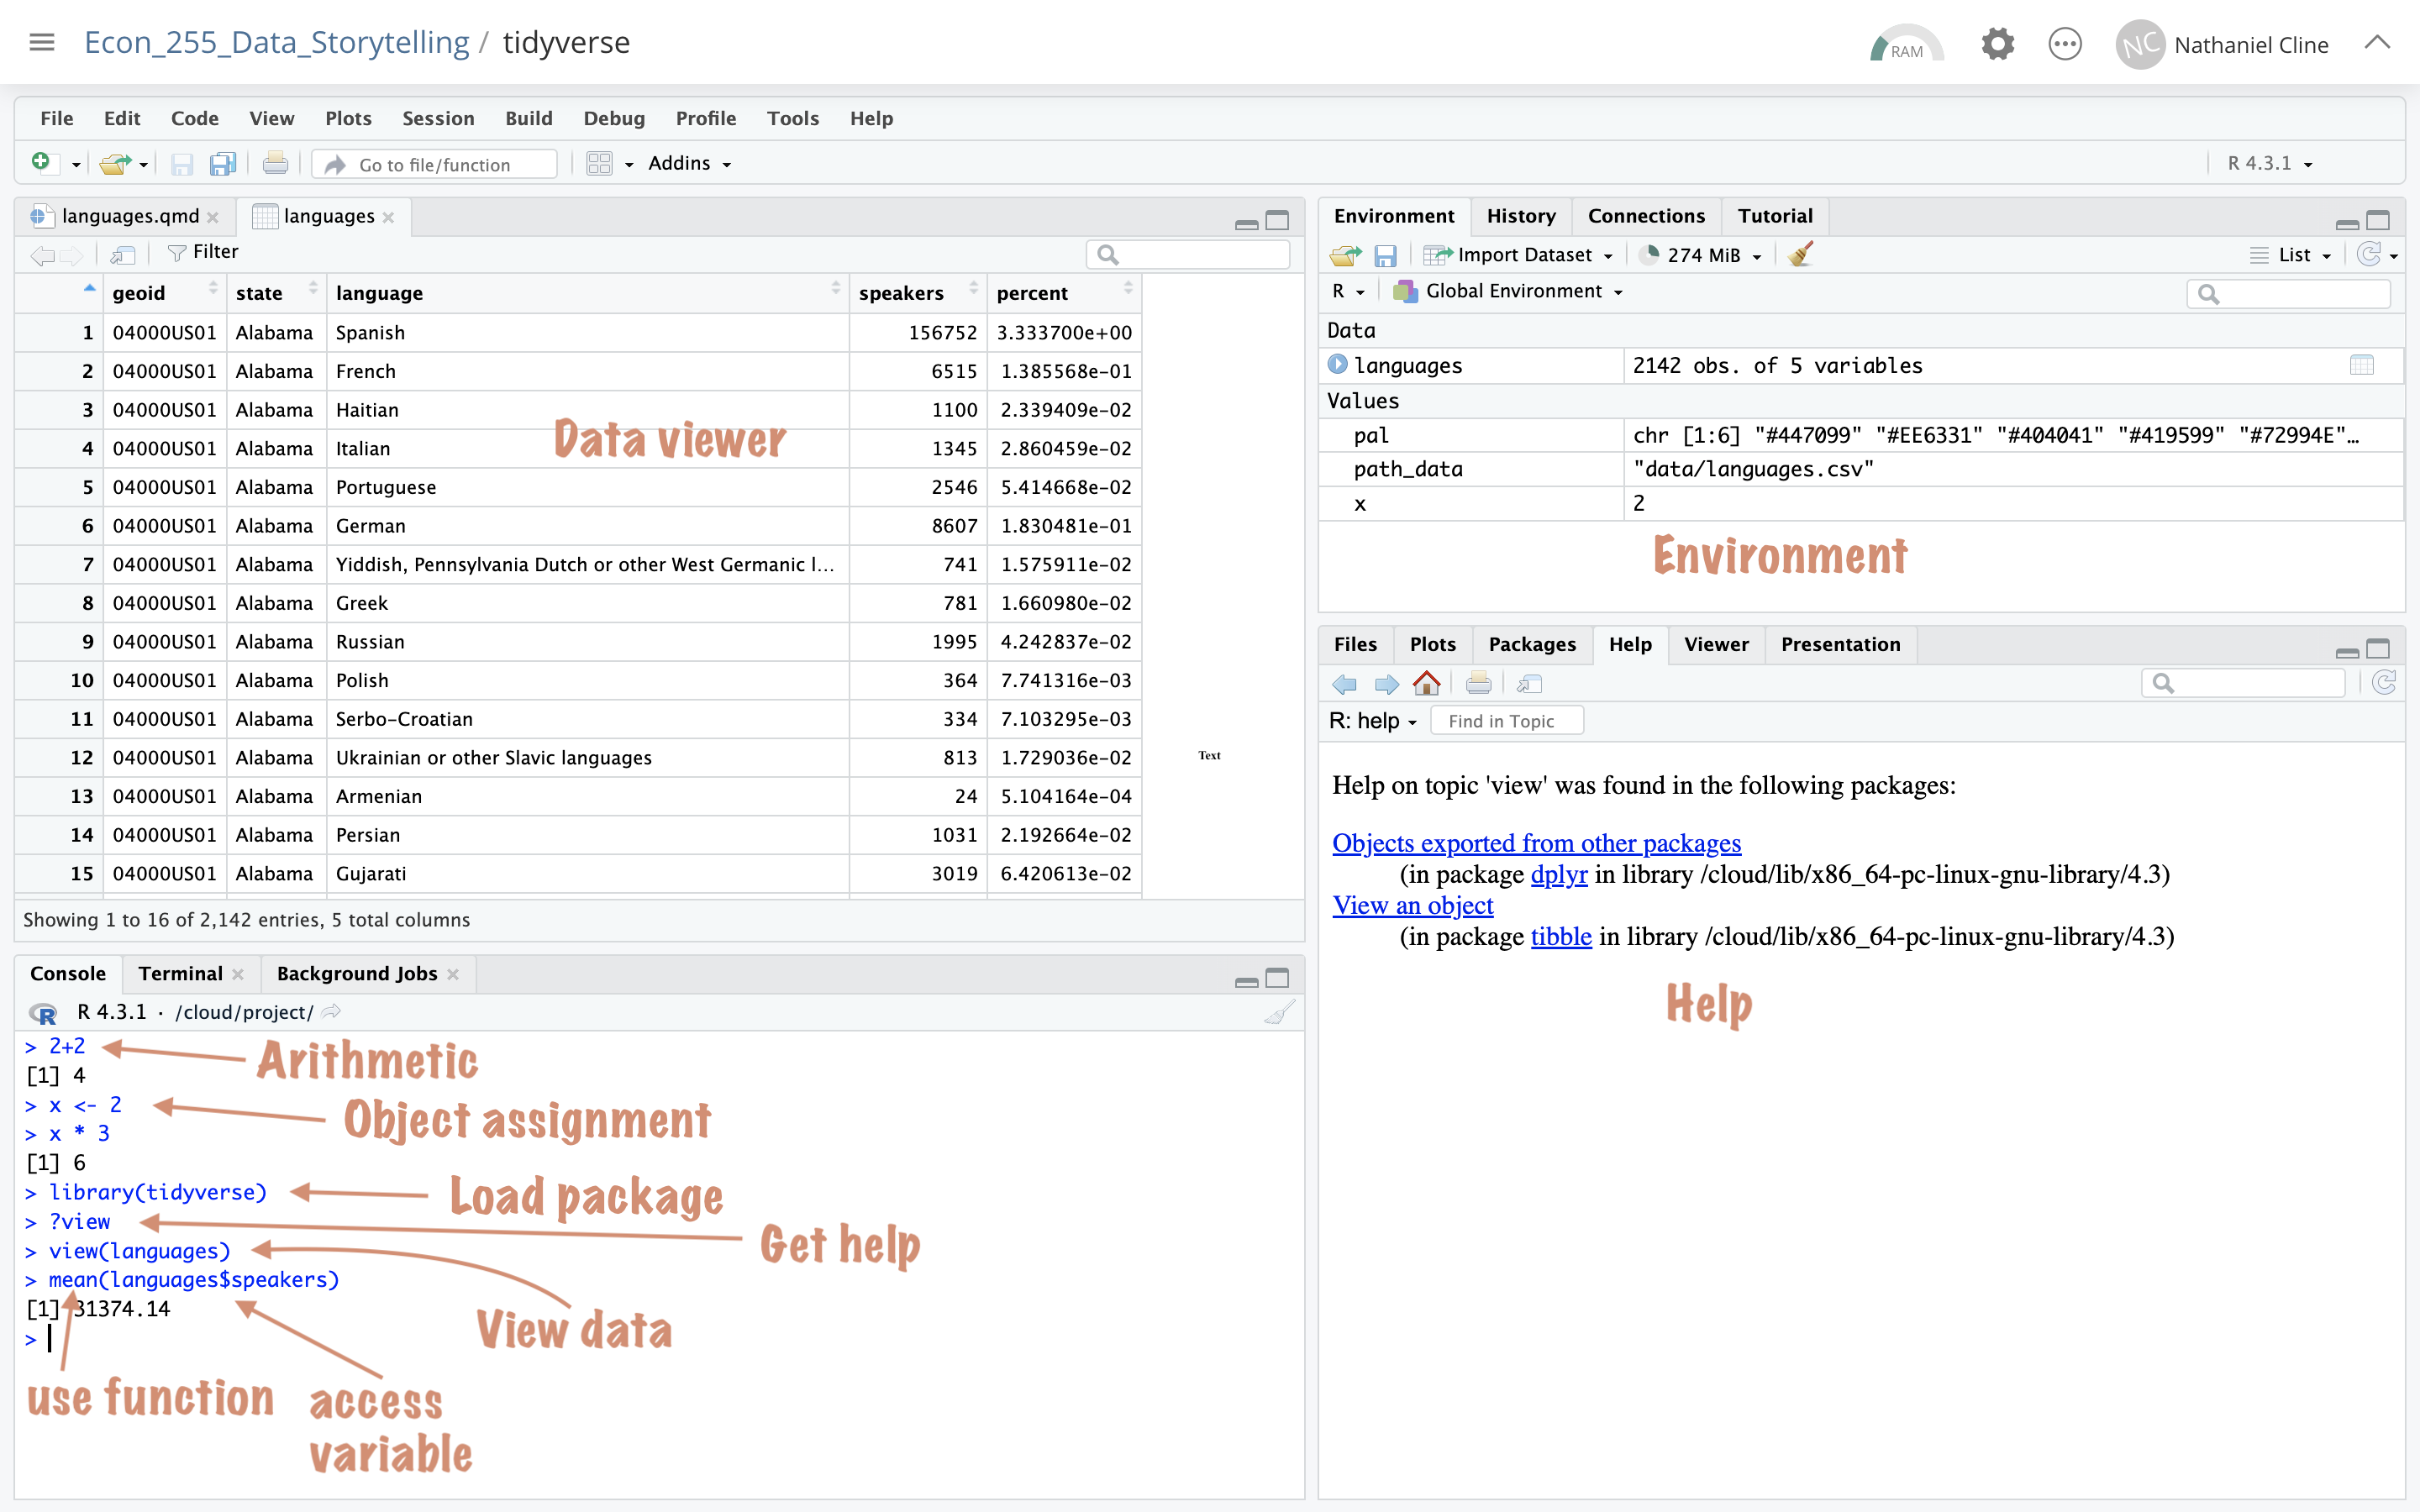
R Studio tour
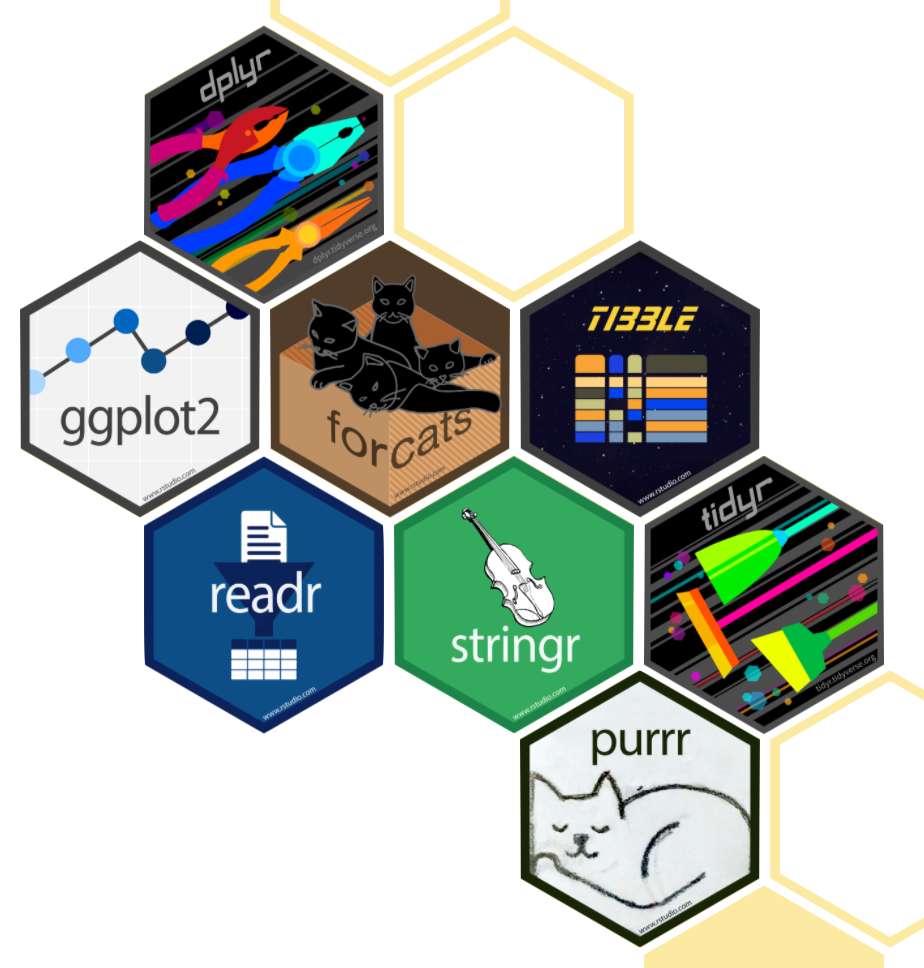
tidyverse
- The tidyverse is an opinionated collection of R packages designed for data science
- All packages share an underlying philosophy and a common grammar
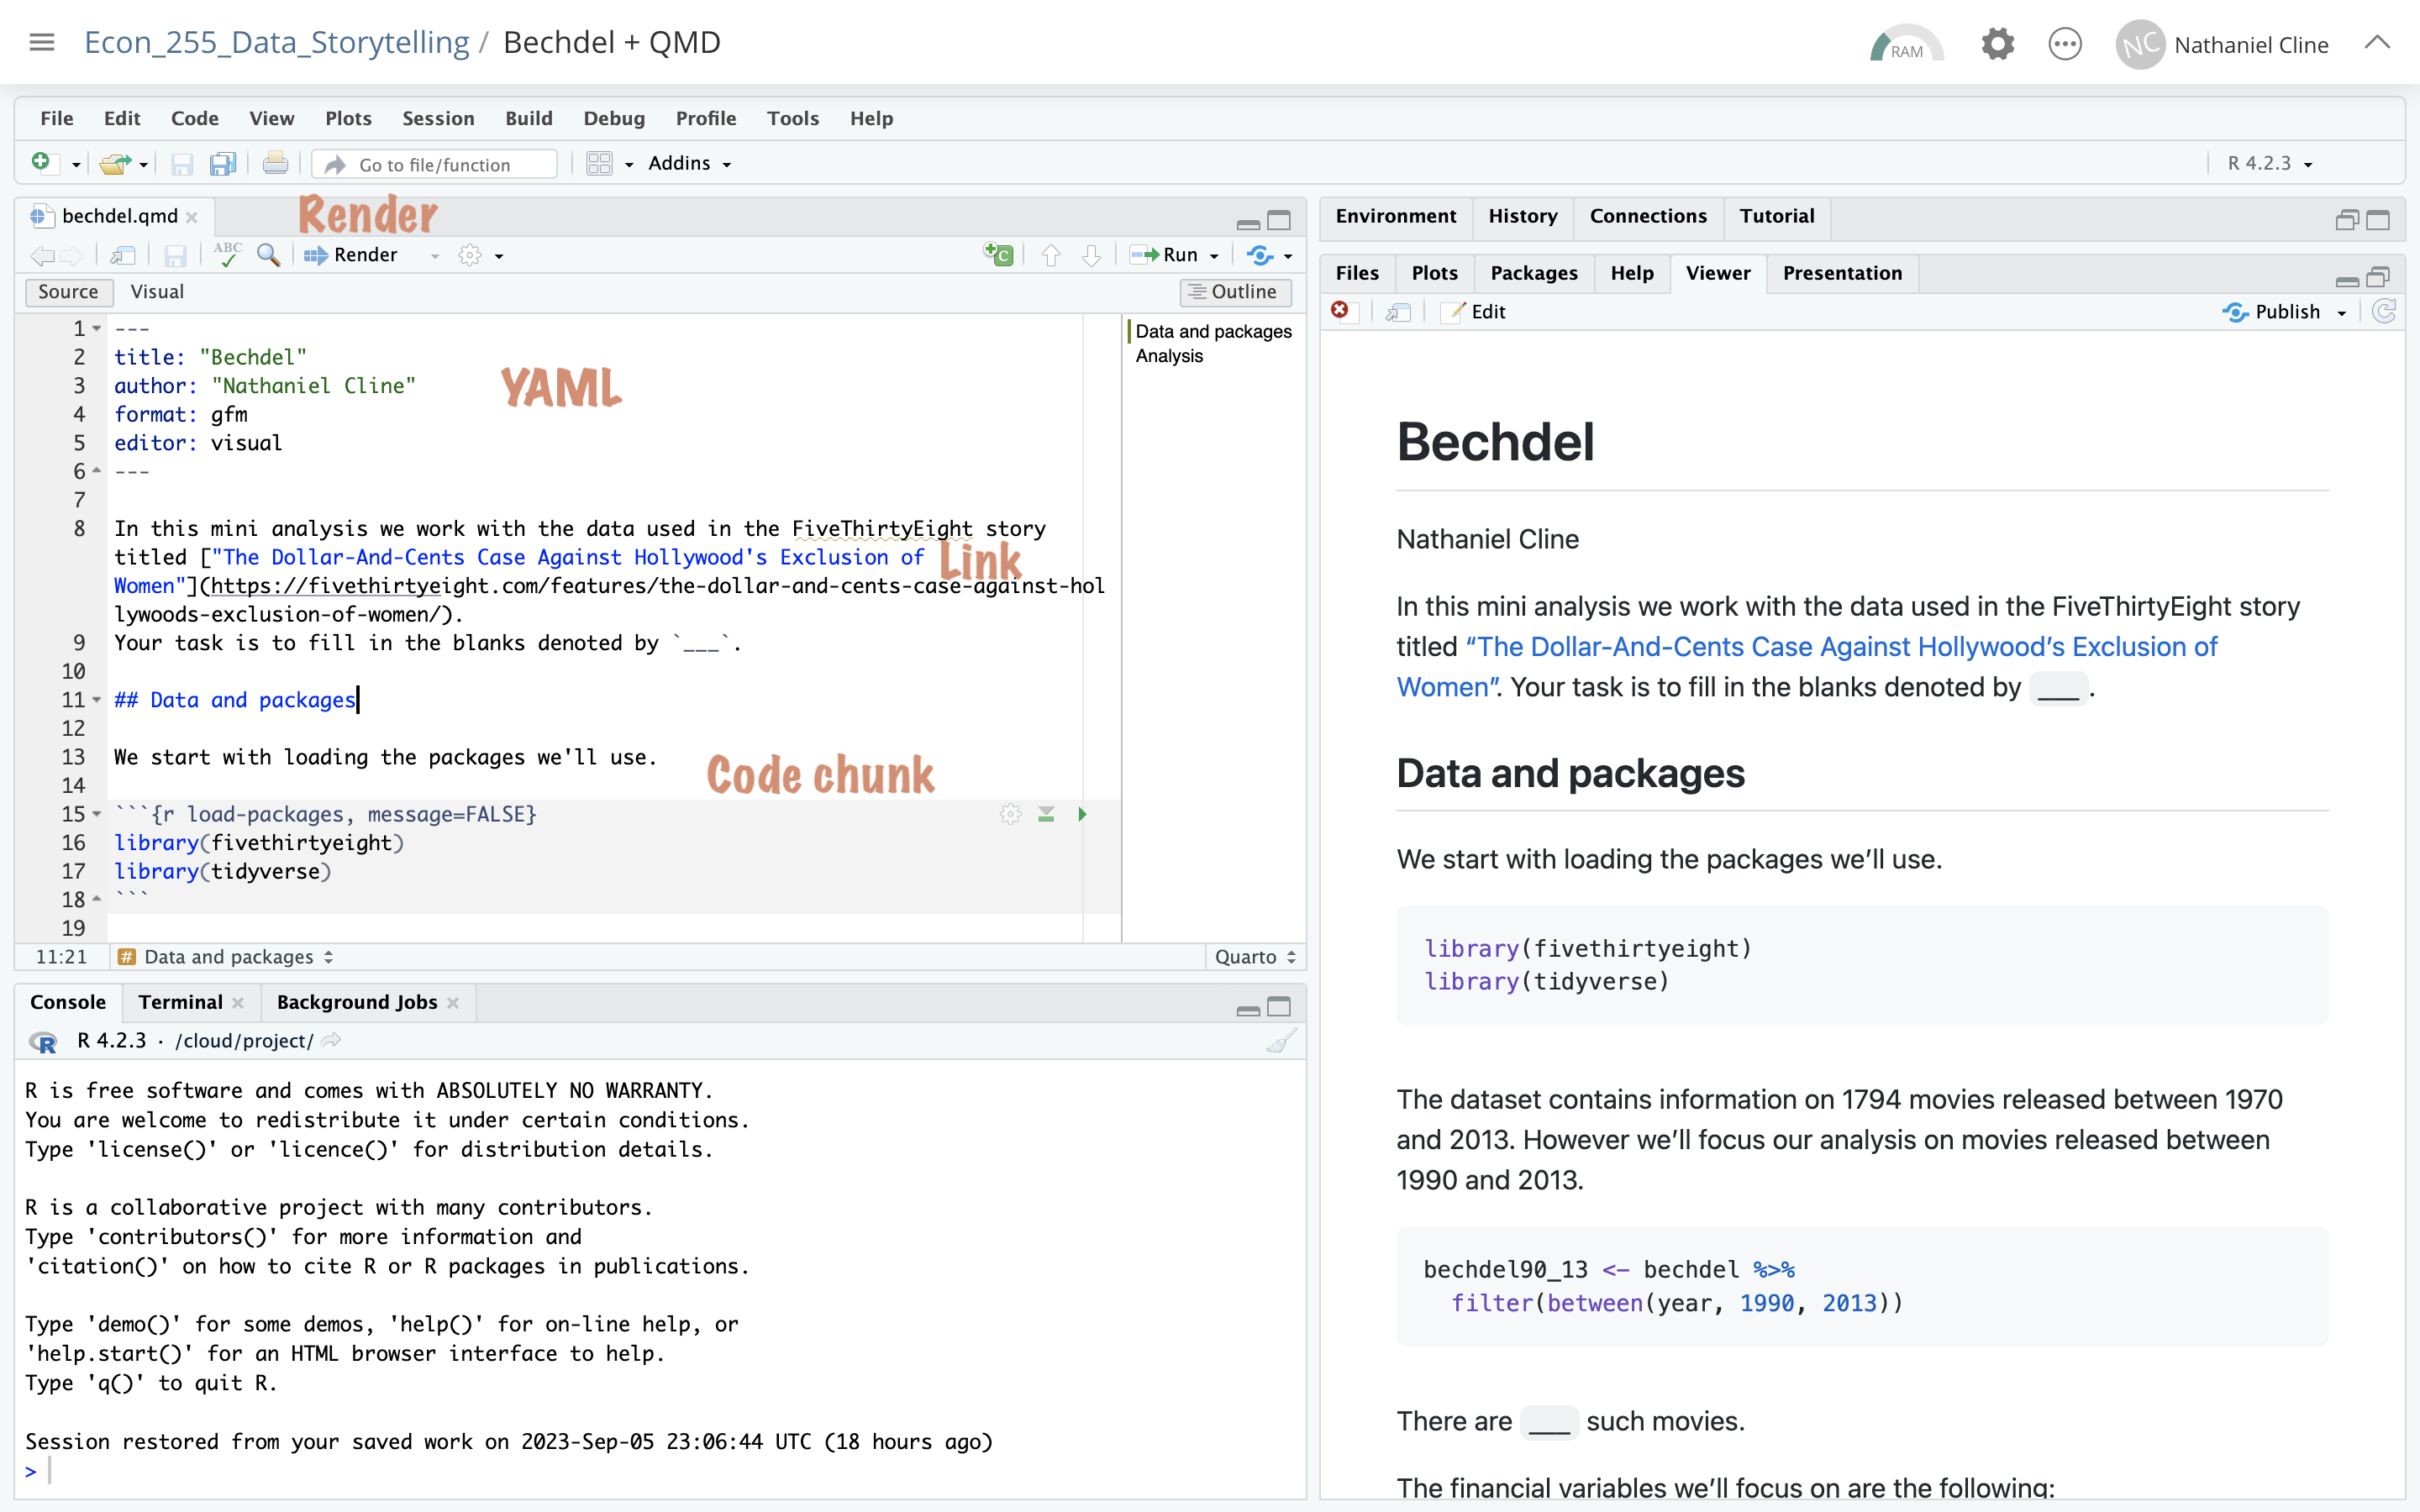
Tour: Quarto
To do
1
Read
Ch. 8, “Importing Data” ;
Ch. 4, “Data Transformation”;
Ch. 6 “Data Tidying”
in: Wickham, Çetinkaya-Rundel, and Grolemund R for Data Science
2
Do
Assignment 3