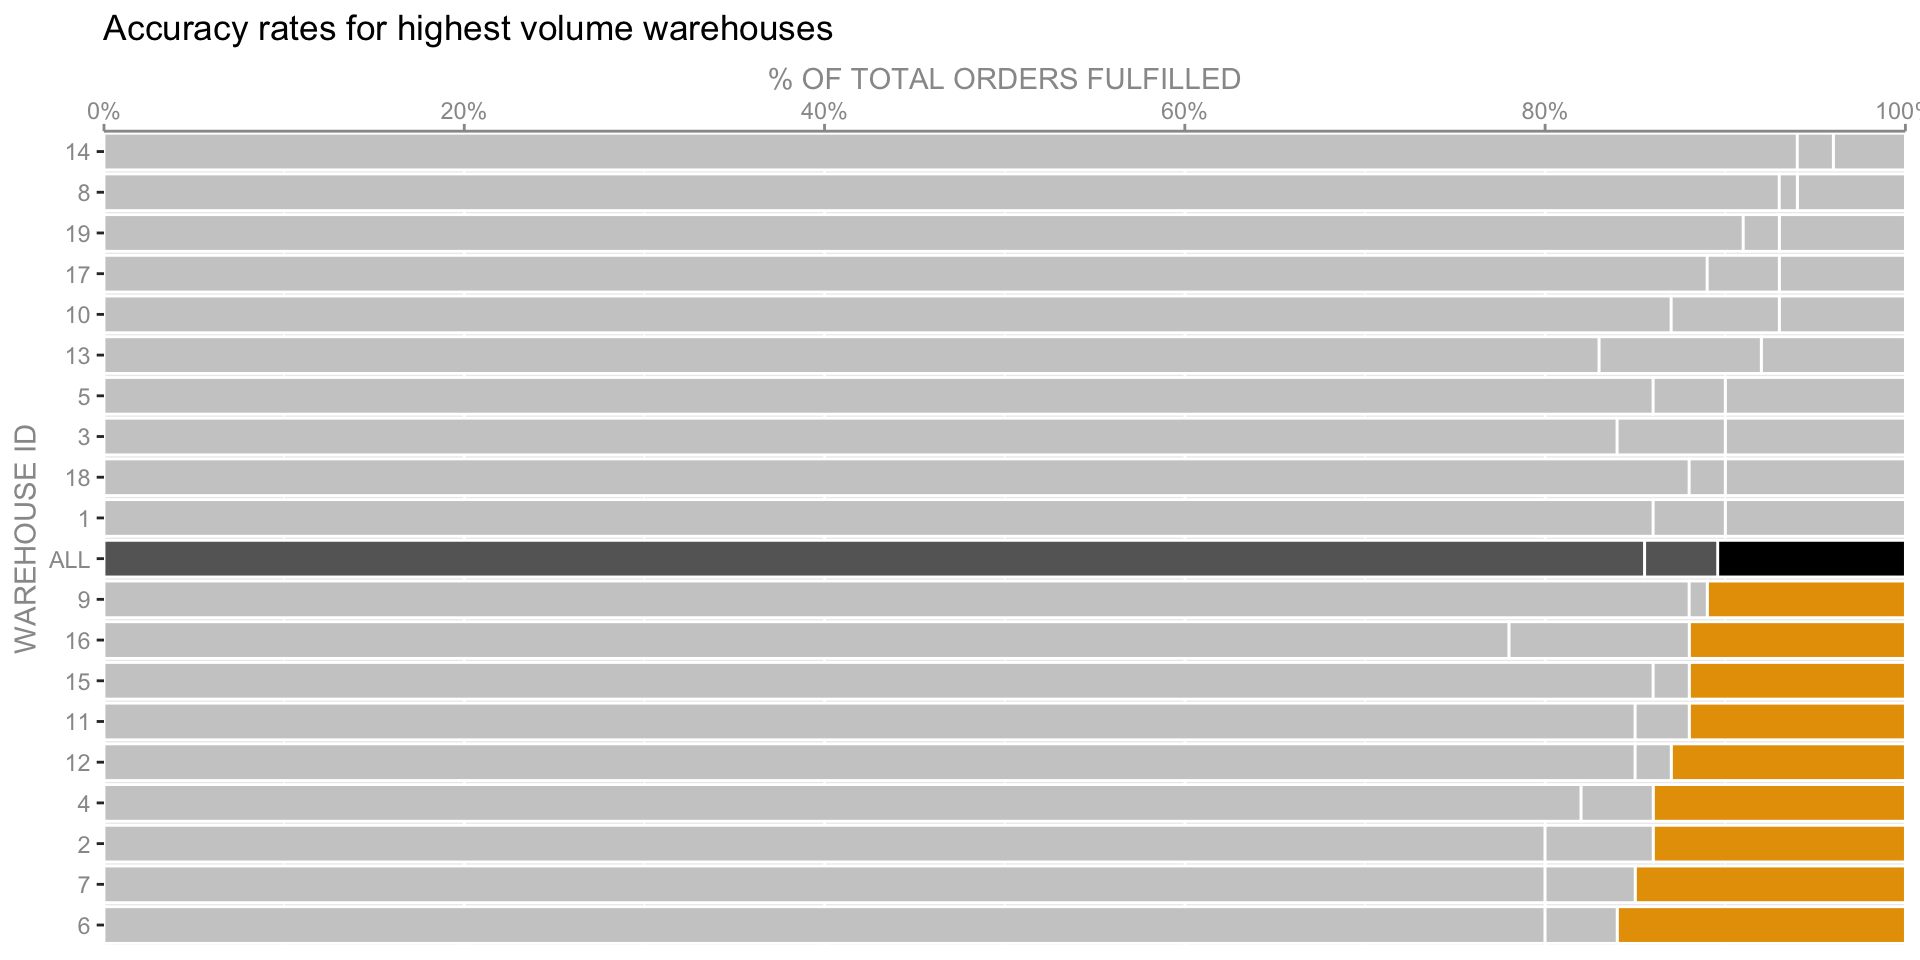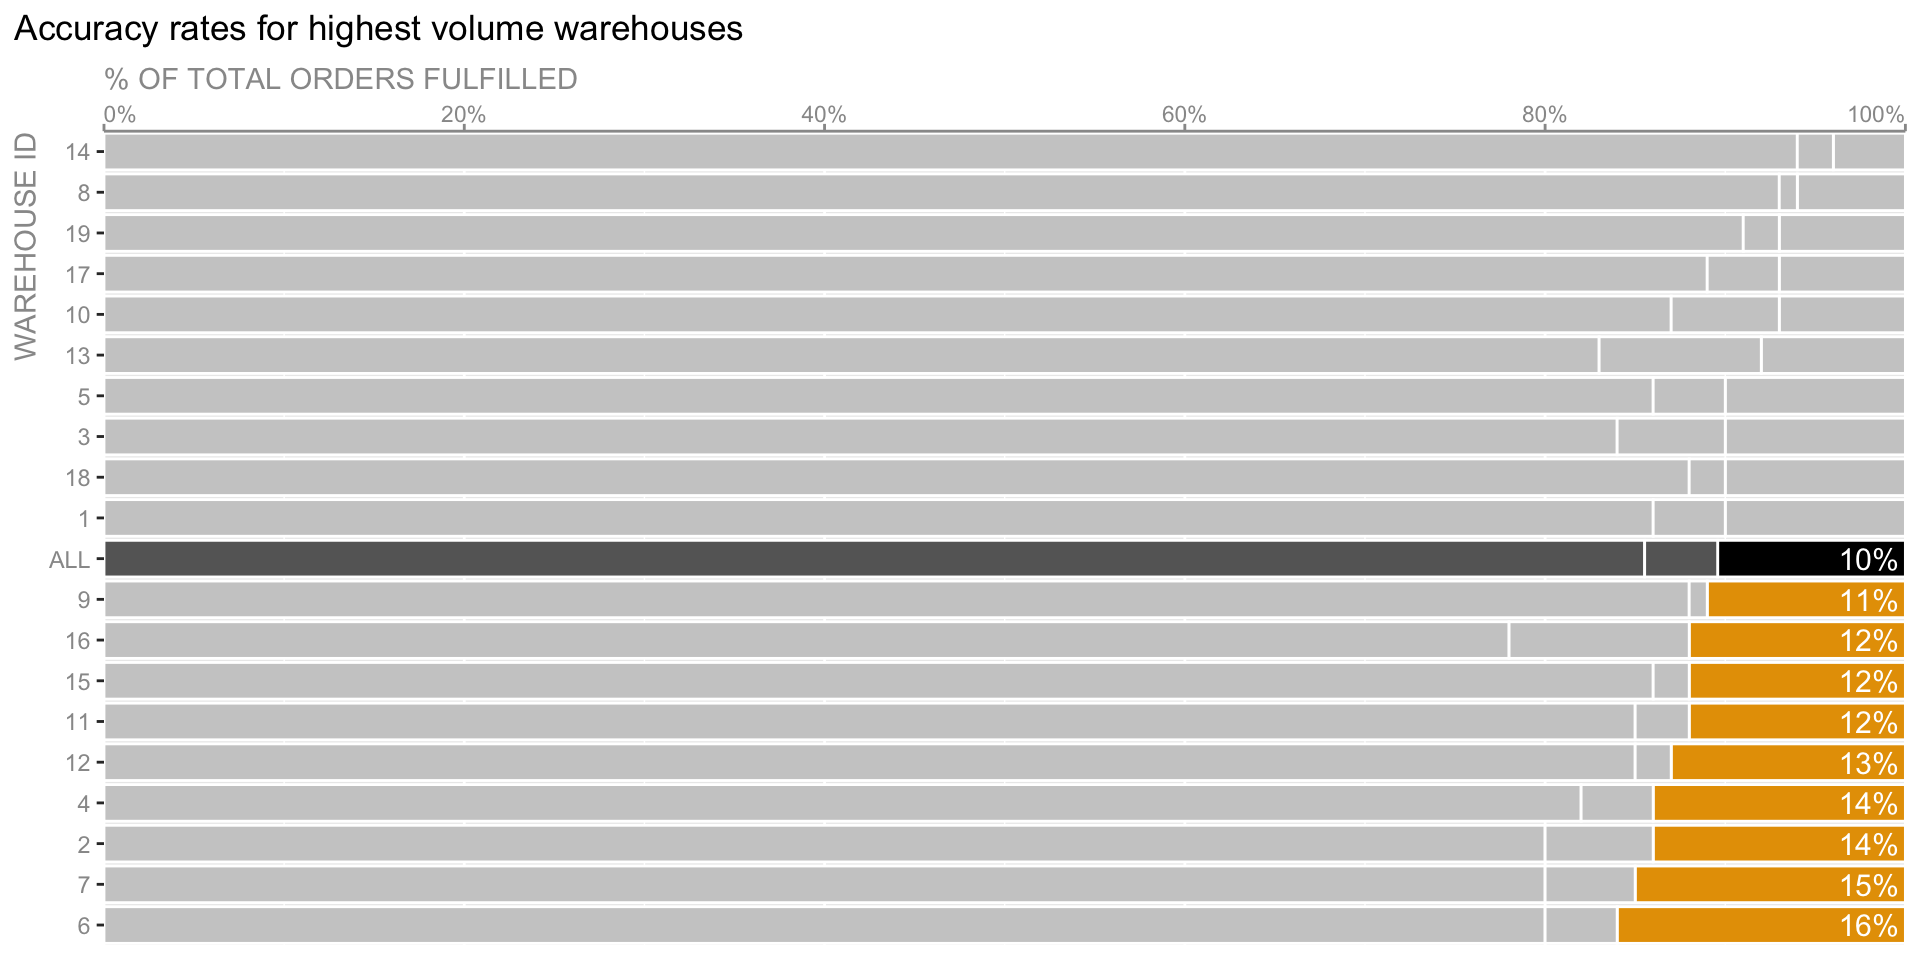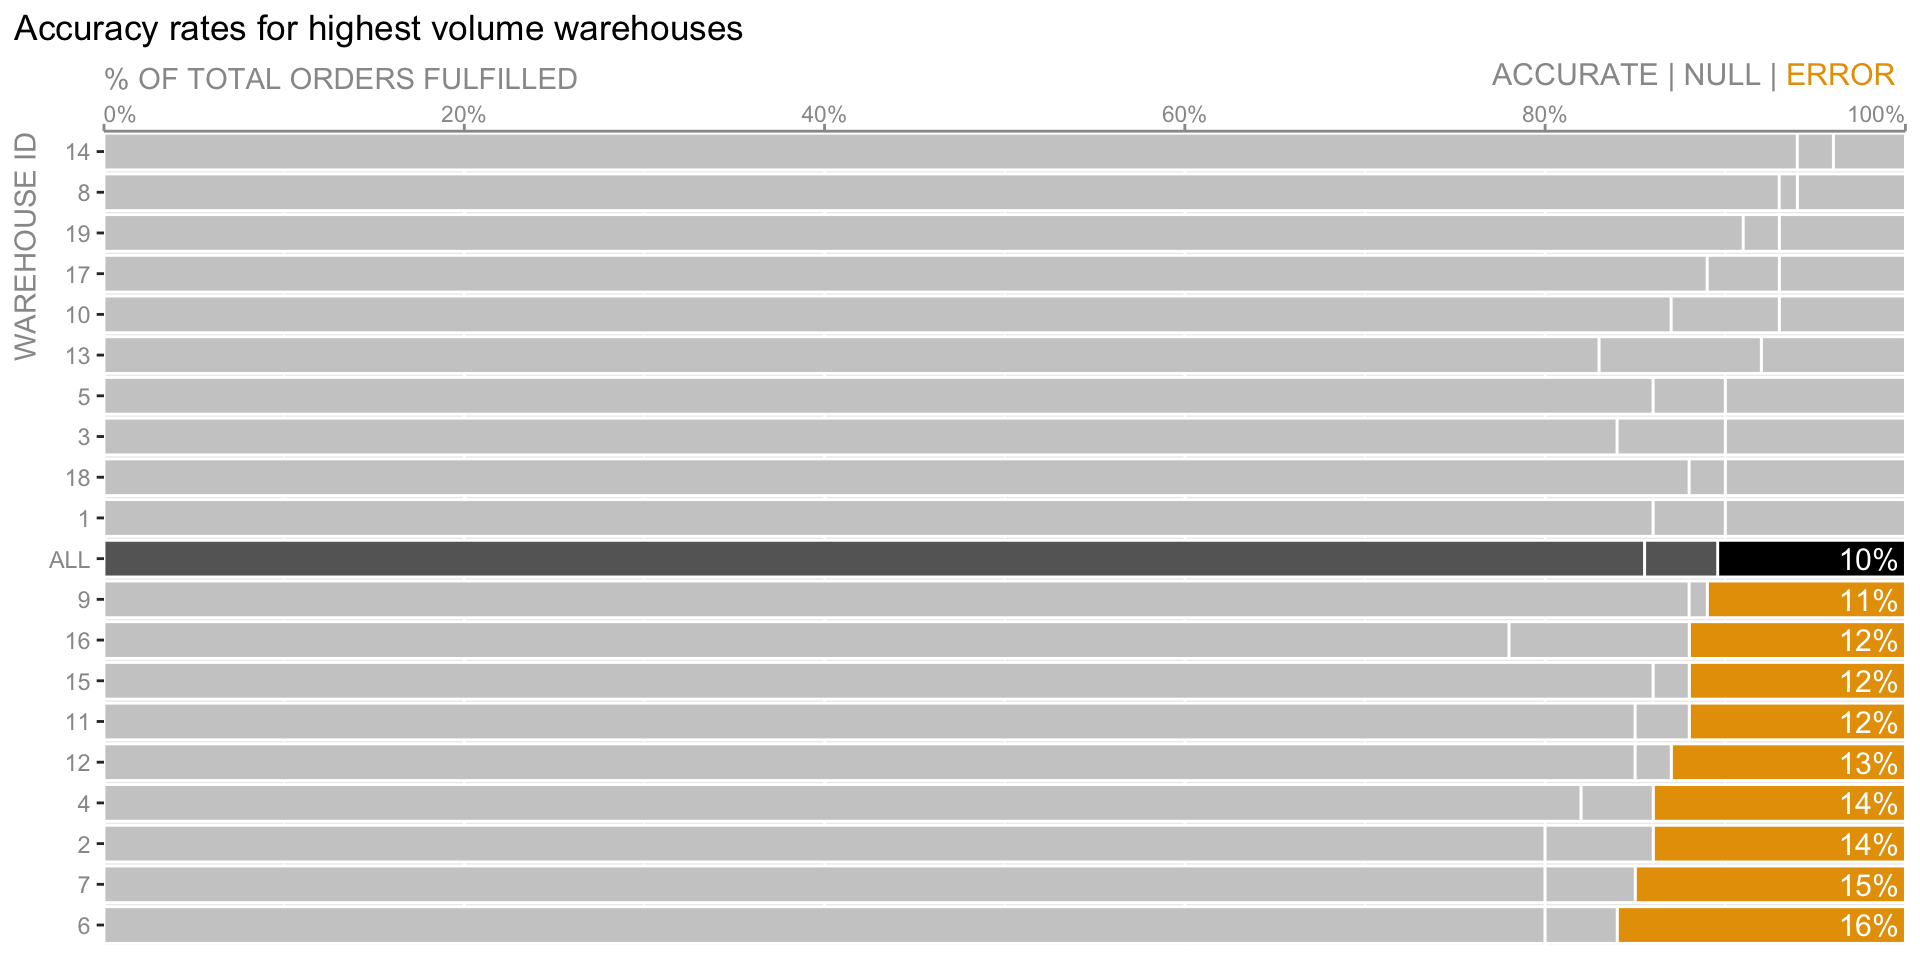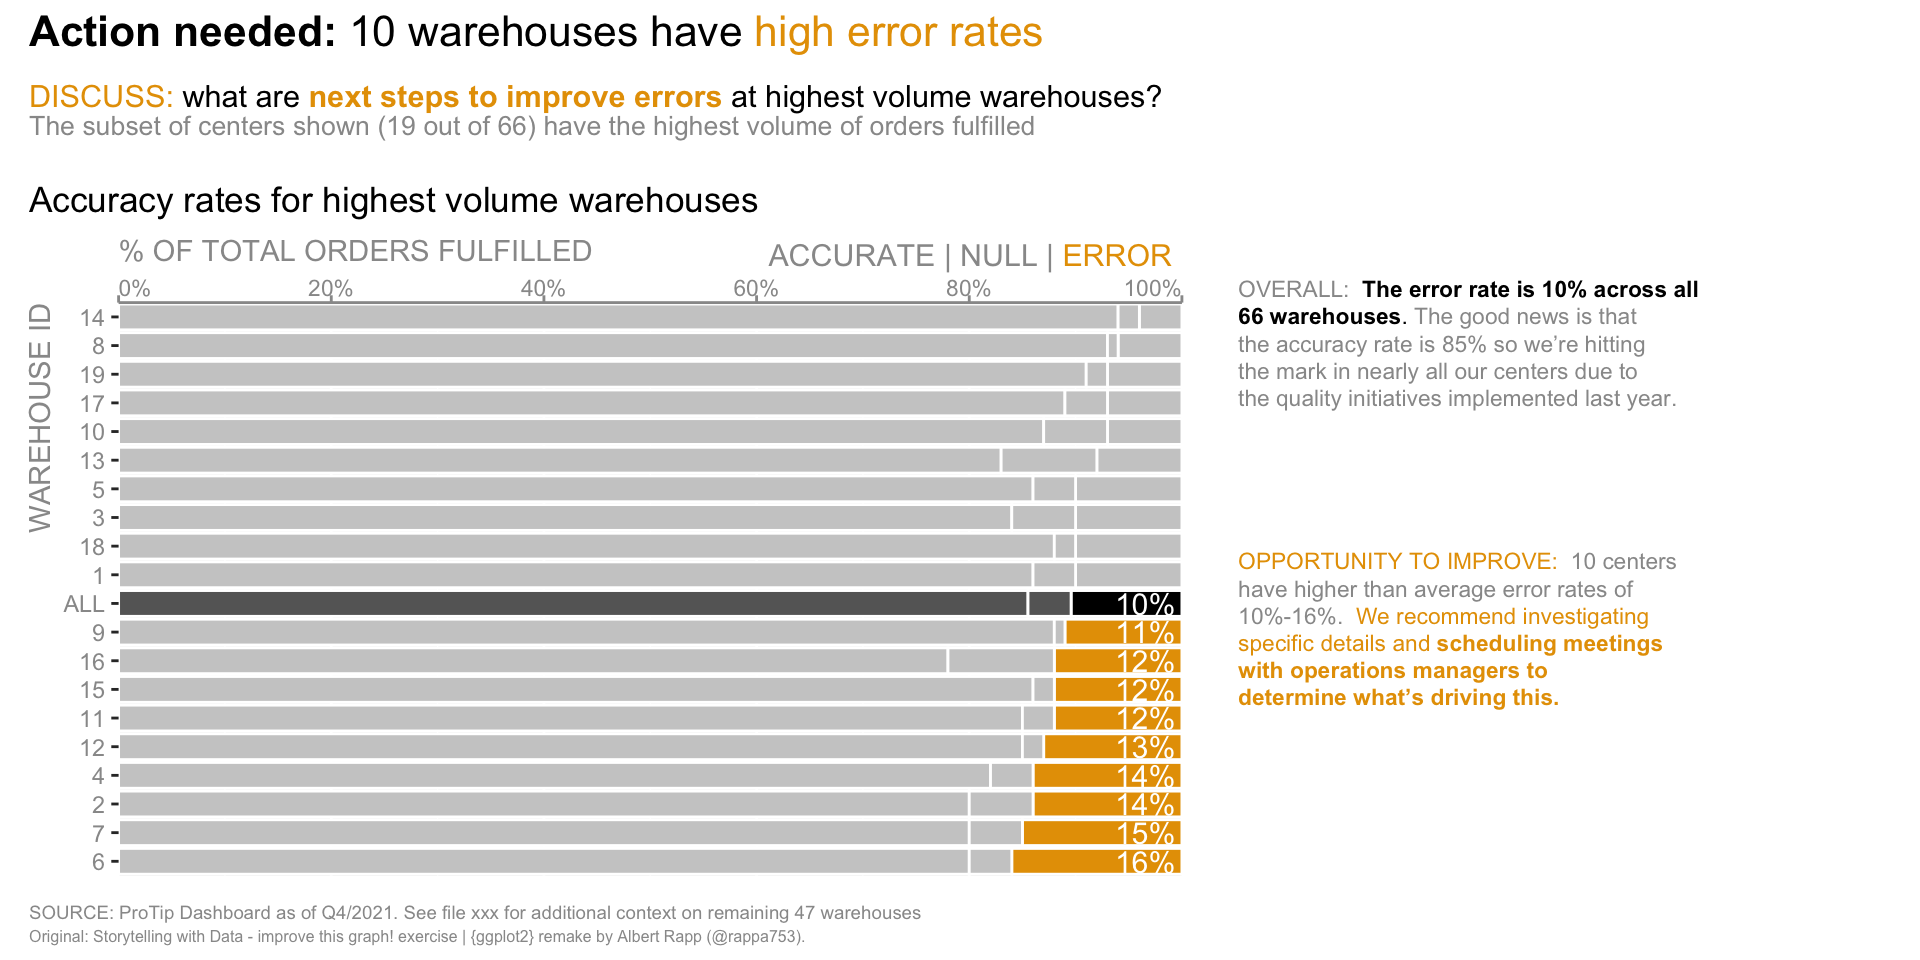
Code
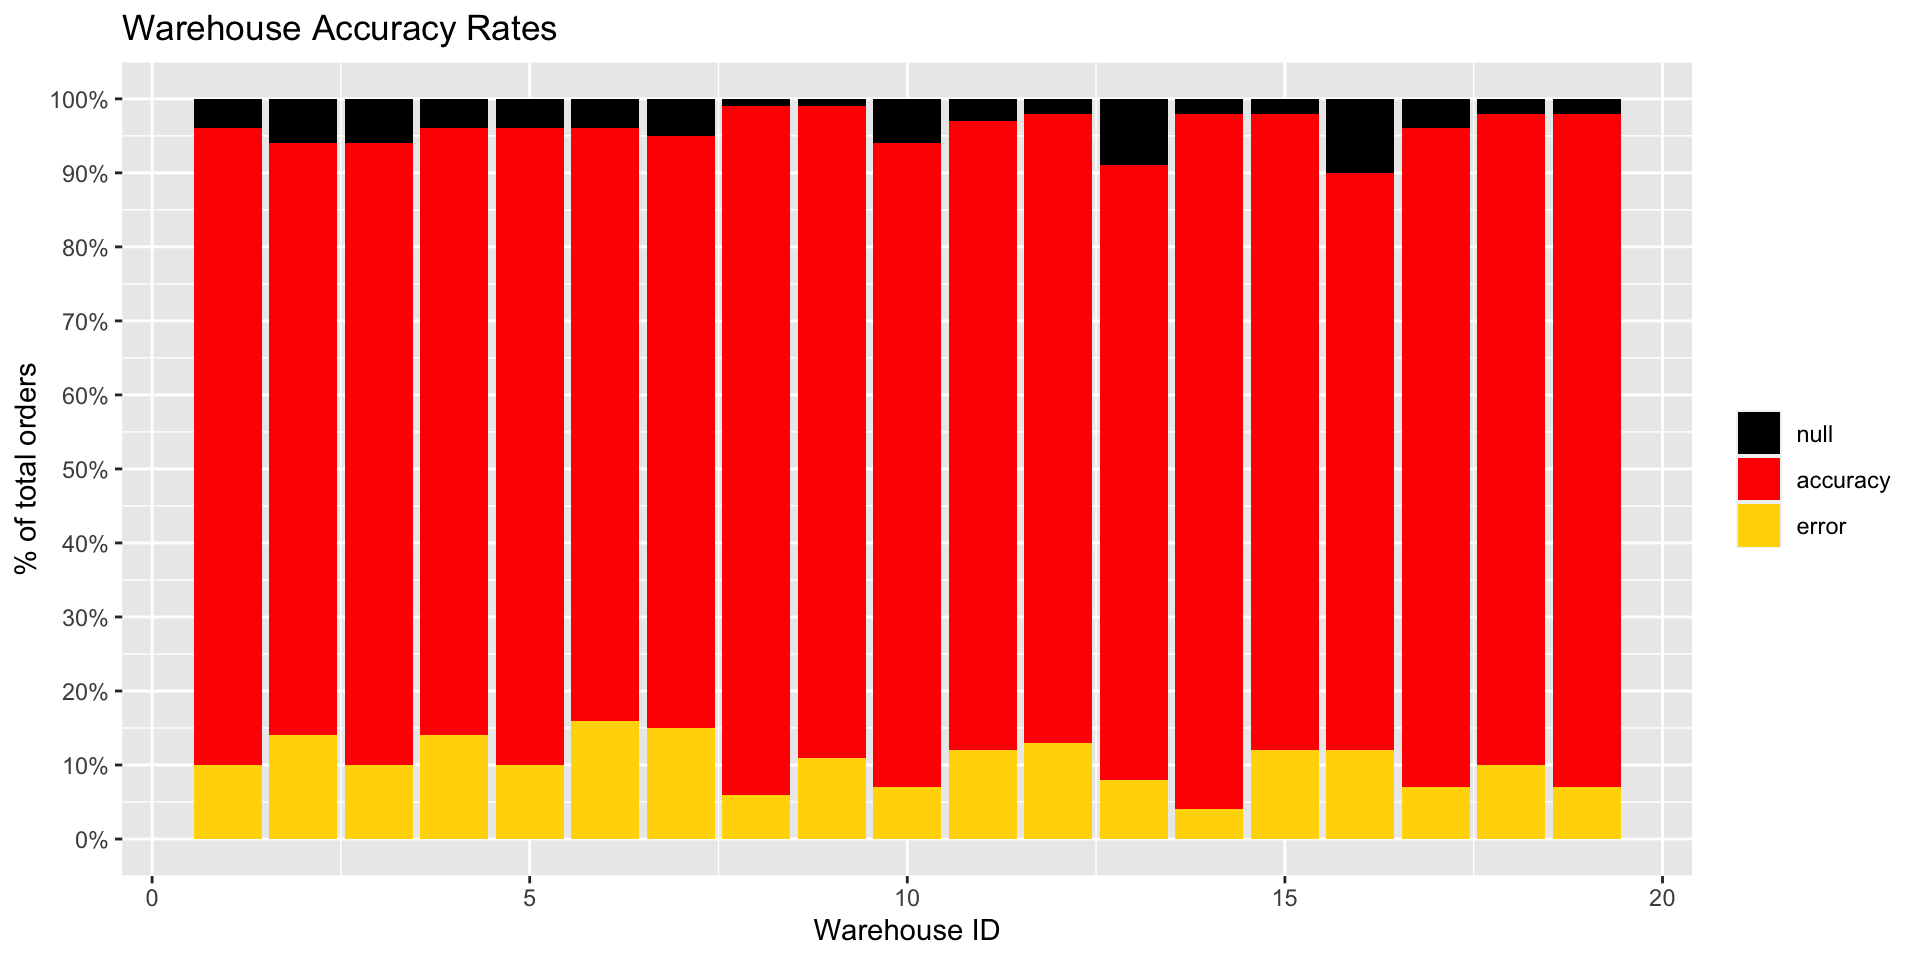
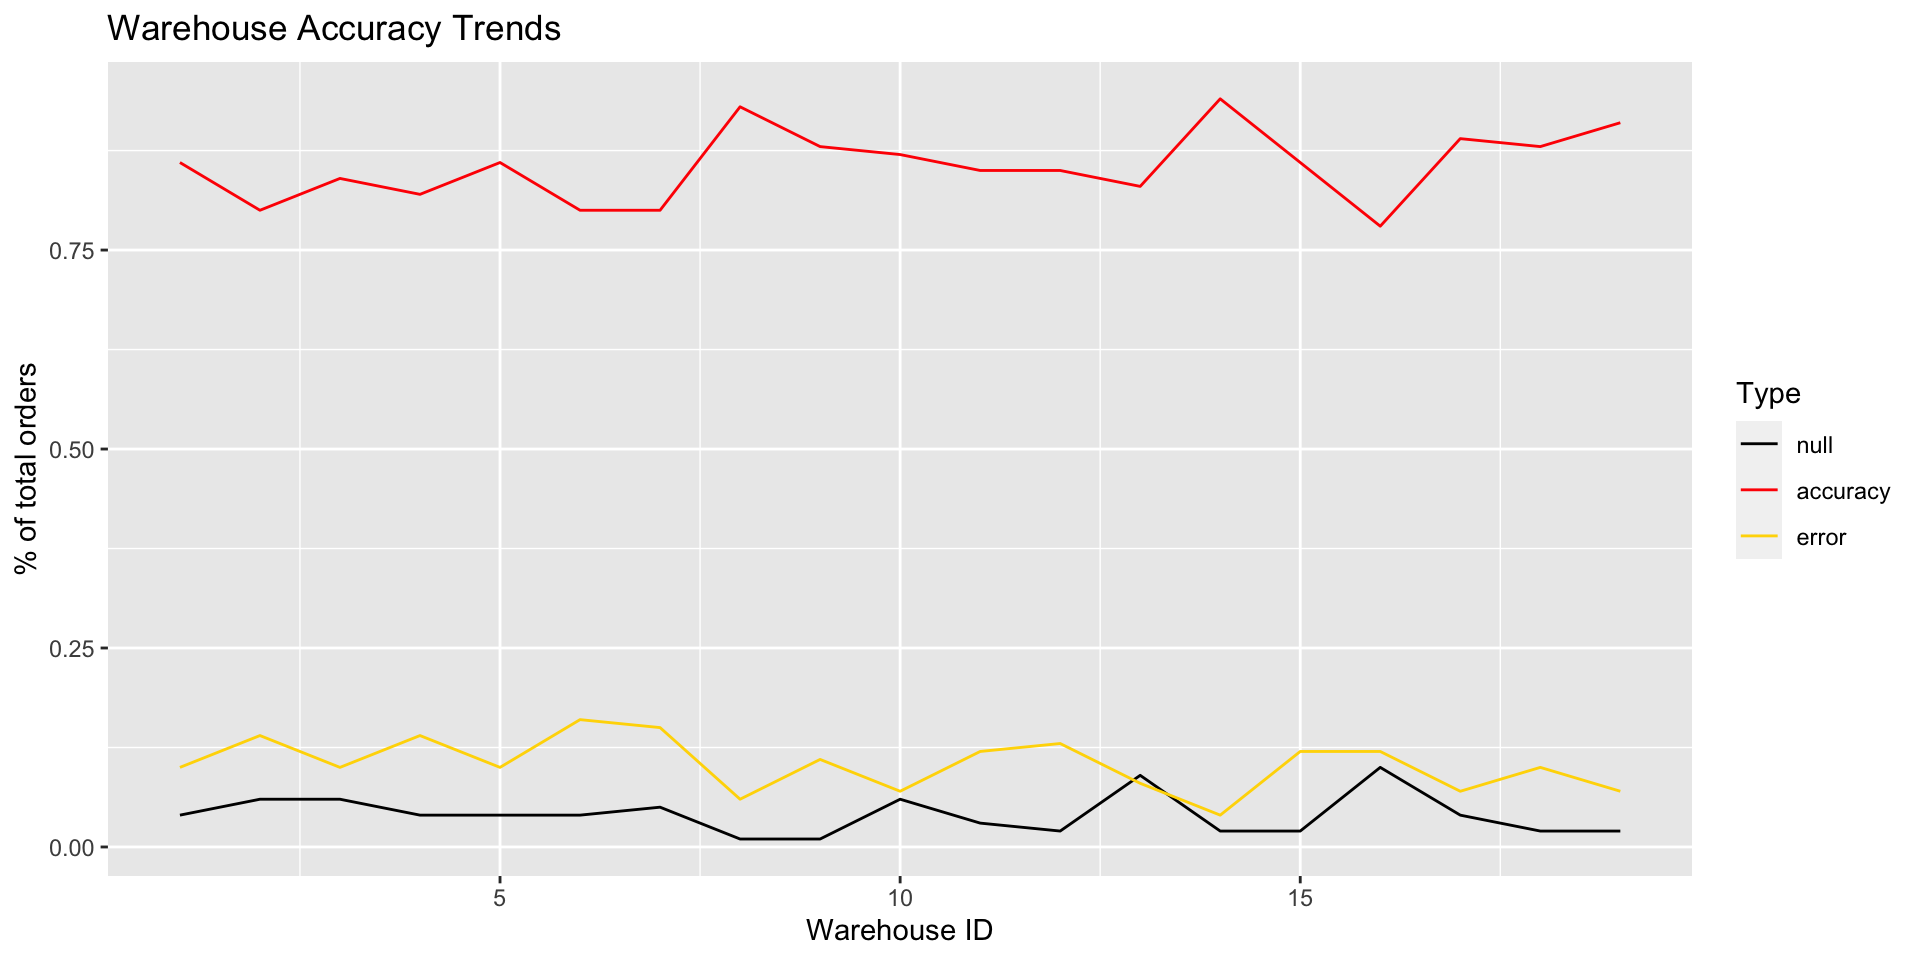
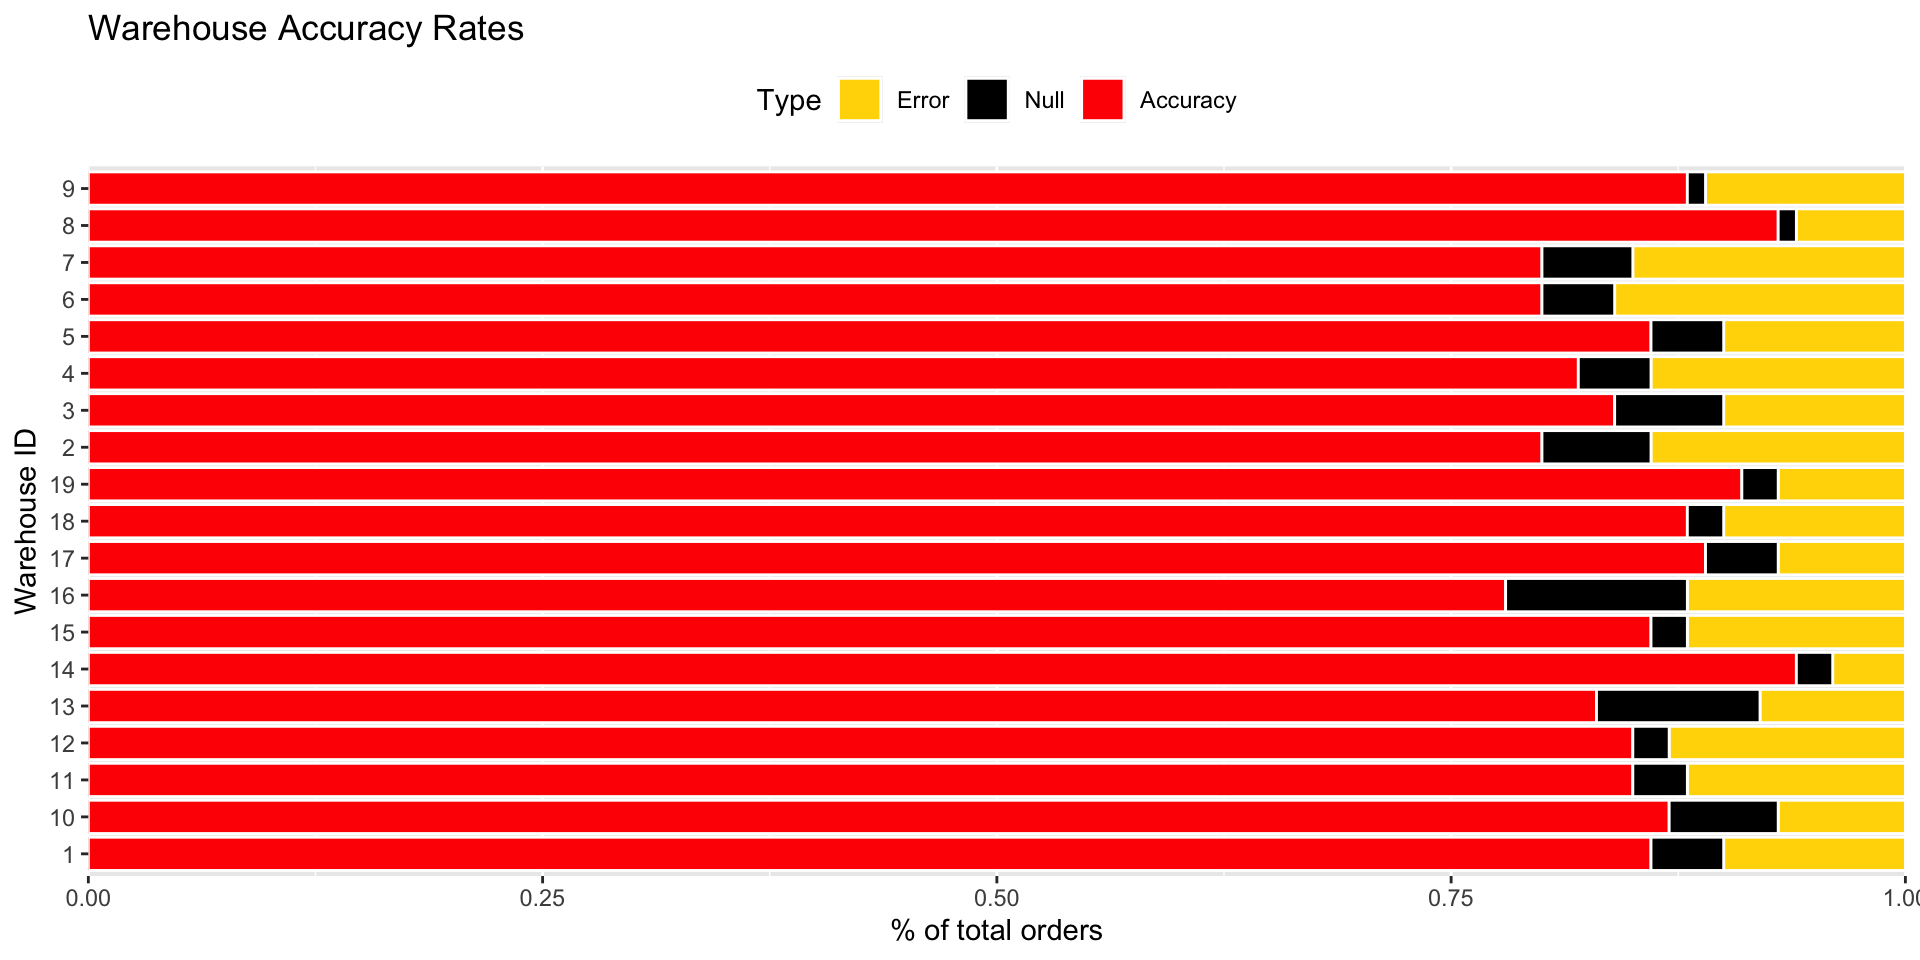
dat_long %>%
  ggplot(aes(id, percent, fill = factor(type, levels = c('null', 'accuracy', 'error')))) +
  geom_col() +
  labs(
    title = 'Warehouse Accuracy Rates',
    x = 'Warehouse ID',
    y = '% of total orders',
    fill = element_blank()
  ) +
  scale_fill_manual(values = c("null" = "#000000", "accuracy" = "#FF0000", "error" = "#FFD700")) +
  scale_y_continuous(labels = ~scales::percent(., accuracy = 1), breaks = seq(0, 1, 0.1))