A Toolkit of Techniques
Agenda
1
A Toolkit of Techniques
2
Your Job
3
Choose Your Own Adventure
Warm-up critique
Scenario
imagine you work as an analyst in consumer credit risk management.
Once loans become 180 days past due, they are categorized as “Non-Performing Loans.”
Banks have to reserve money for these potential losses.
You’ve been asked to create a graph showing how Non-Performing Loan (NPL) volume compares to the Loan Loss Reserves over time.
A toolkit of techniques
R
So far we have focused on the R programming language, which has major advantages:
Imagine dealing with our county data set (3,000+ rows, 100+ columns) in Excel!
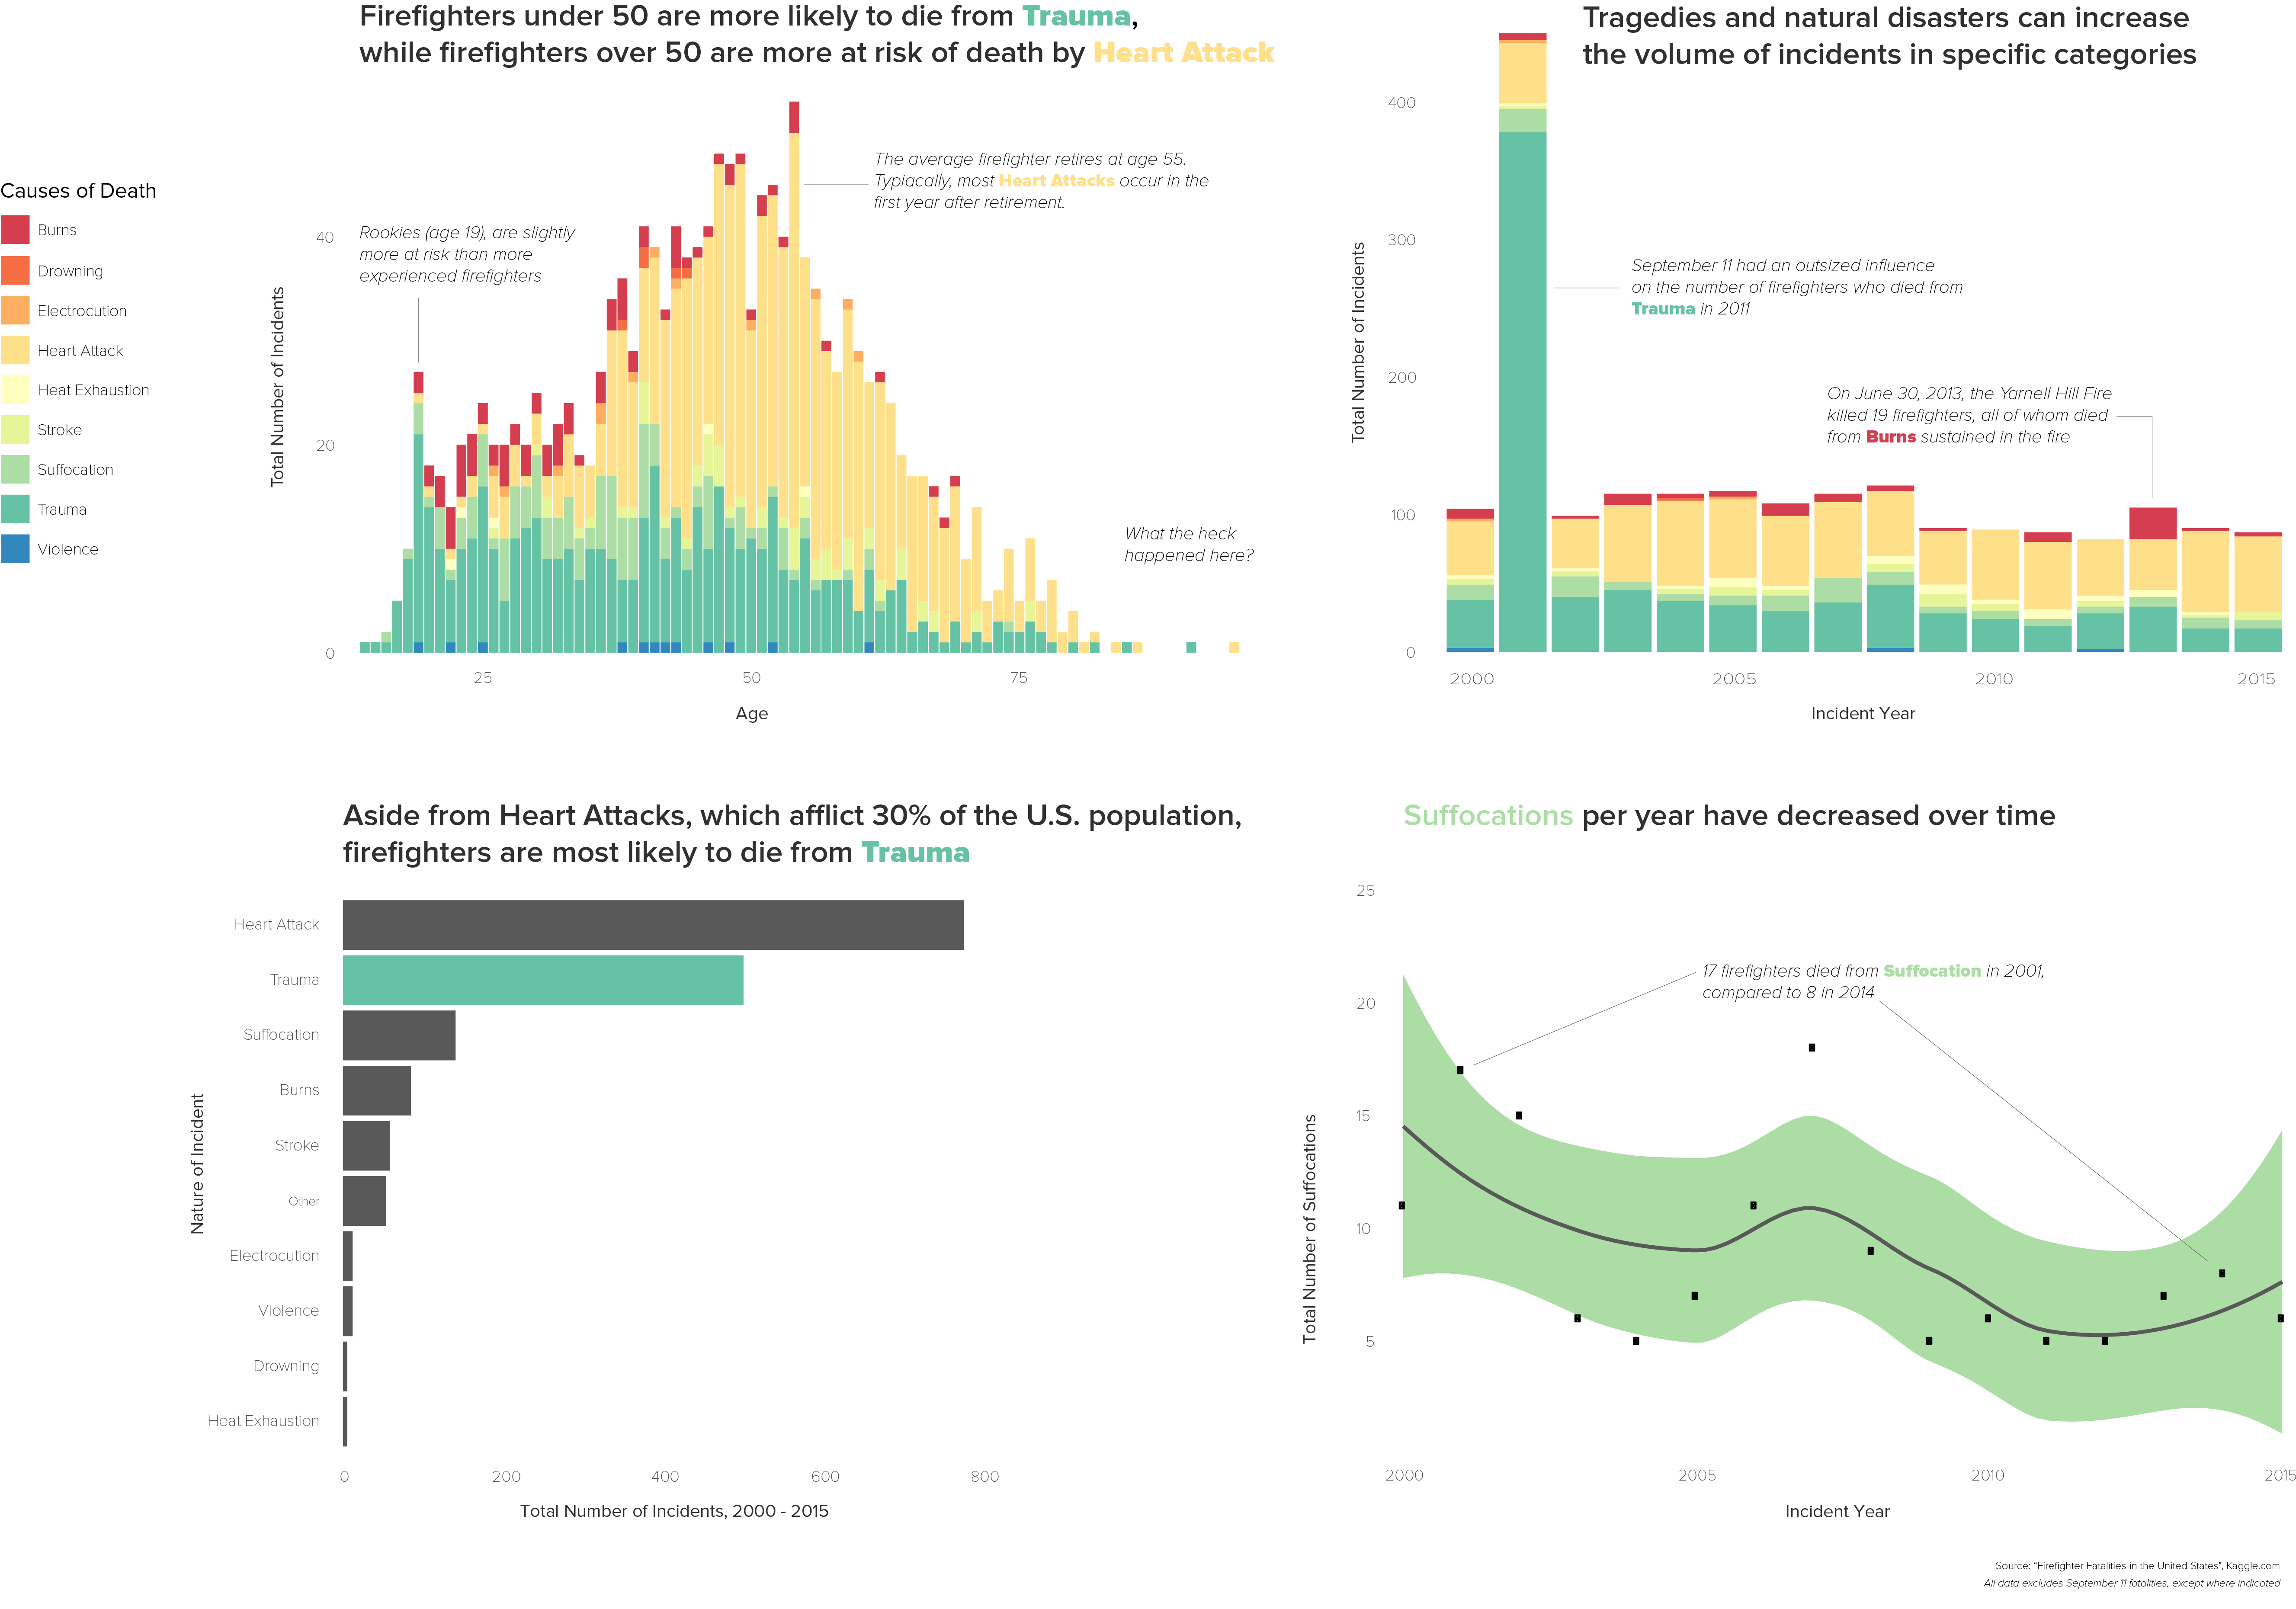
R can produce stunning graphics
Because R is useful but hard to learn, it is a rare and valuable skill
There is more than R
But, there are many more ways to not only create charts, but to make data meaningful (R may still be useful in getting data ready)
Today I’d like to talk about some of the ways we can can communicate data and then discuss your final projects
What else?
We often think of:
- Infographics
- Slide decks
- Reports
Maybe now you are thinking of
- Scrollytelling articles
- Interactive charts
What else is there?
Video!
Webpage!
Laser Cut Food
Corporate Social Media
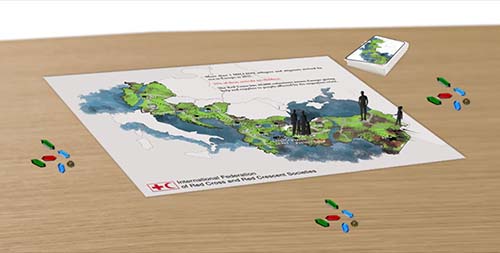
Board Game!
Buzzfeed Quiz!
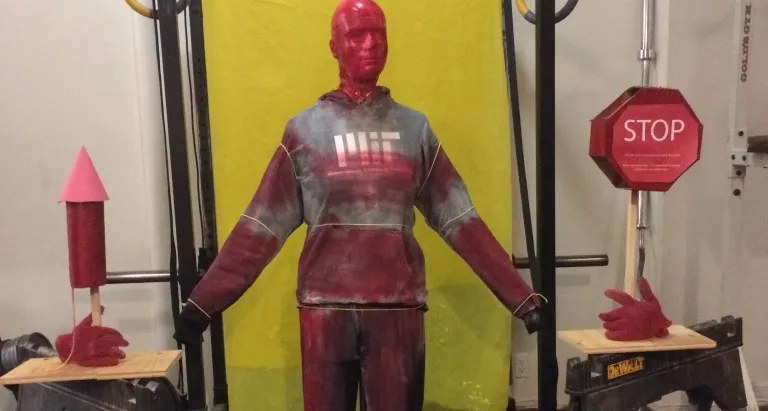
Data Physicalization 1
Data Jewlery
Data Physicalization 2
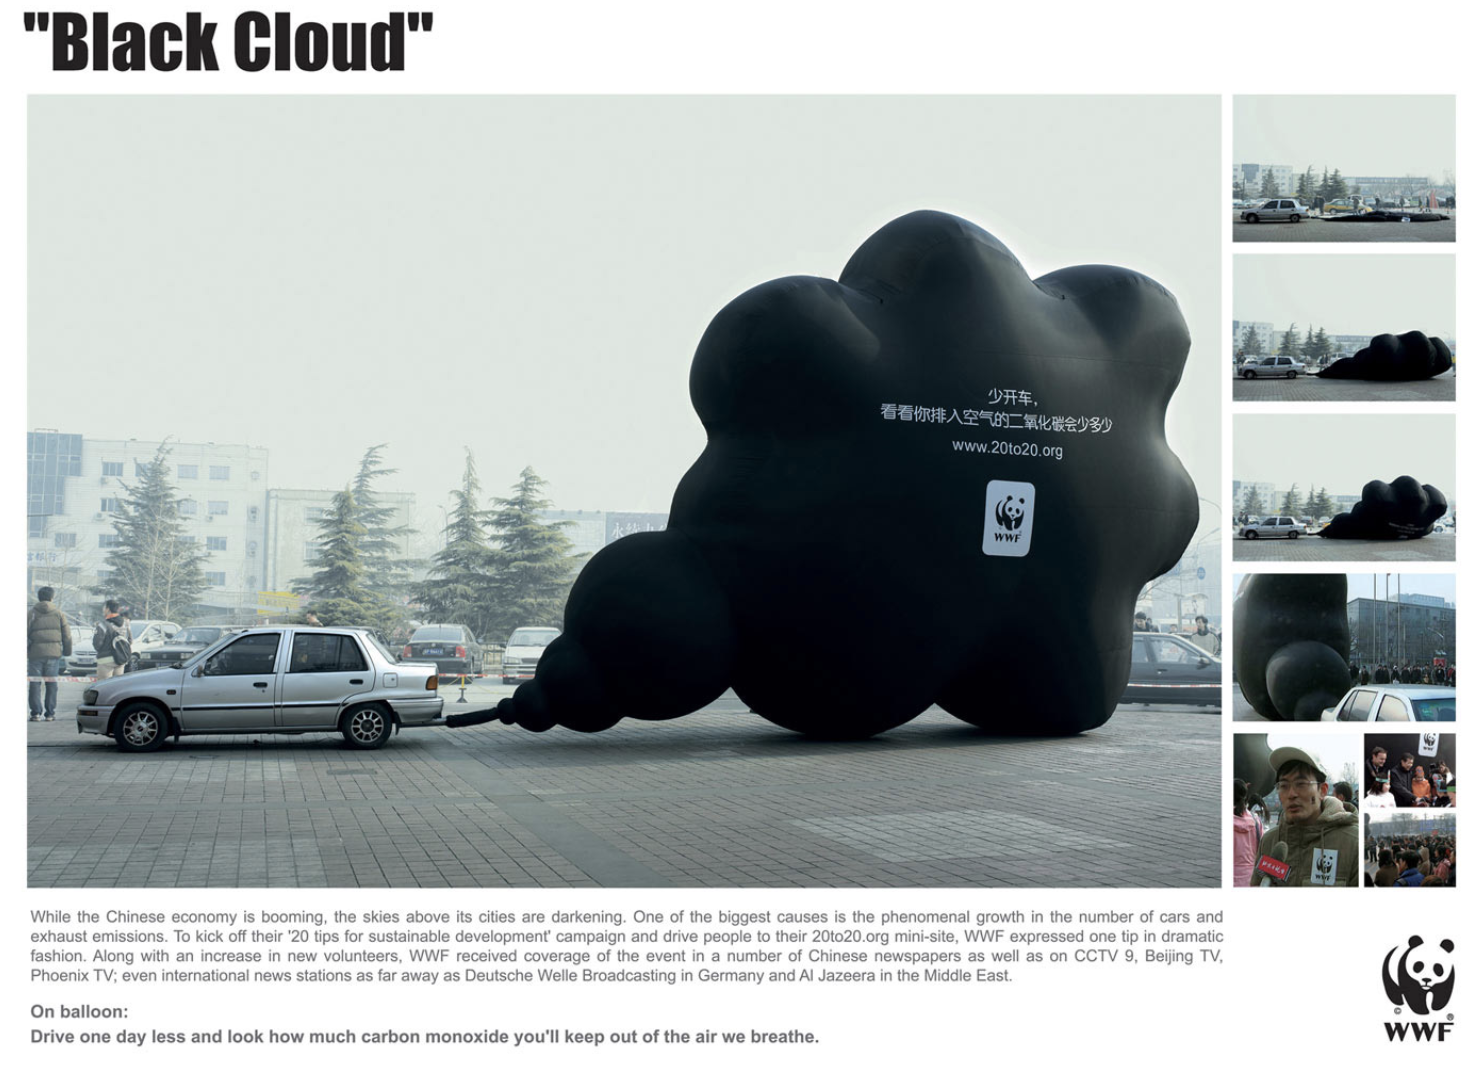
Data Art Installations
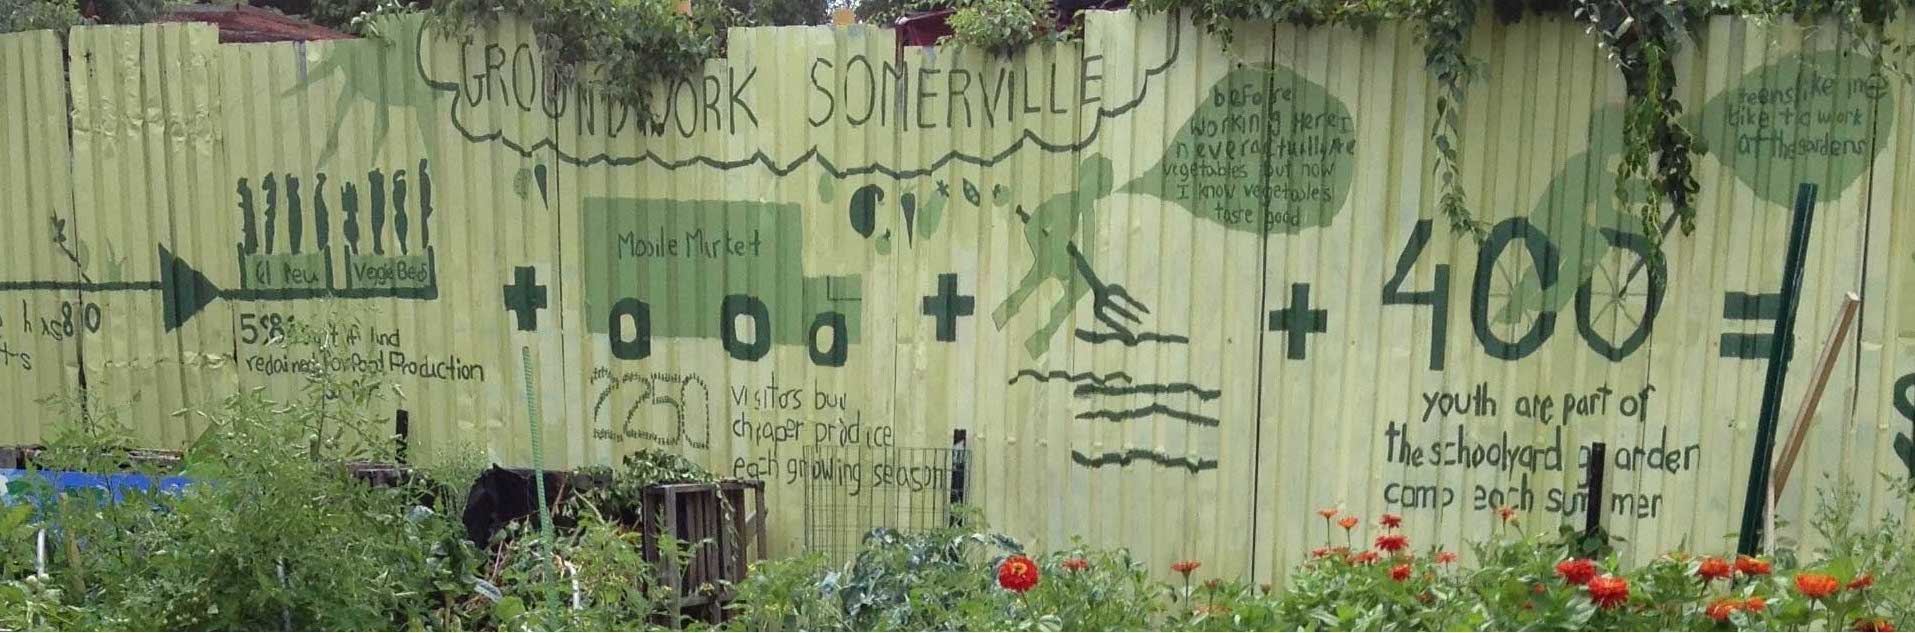
Data Mural
Data Comics
And of course, if you’ve enjoyed R…
Your Job
Create something
Remarkable
Rules
- Insightful, data-based story with a clear connection to the “American Dream” broadly interpreted (work with raw data)
- Presentation of that story with a well defined audience and goals
- Methodology write up
- Audience assessment tool
- Presentation of the project to our class
Steps
identify a topic and your audience
identify data sets
clarify the big idea
decide on a tool
execute!
collect feedback
Groups
In order to produce something remarkable it is likely that you will need to work with partners.
Some of you may already have partners in mind - others may not
If you have a sense of who you’d like to work with - email me by Friday
If you do not have a sense of who you’d like to work with - we will see if interests align.
Key Dates
Topic, audience and data set: 10/9
The big idea and proposed tool: 10/16
Final product: 11/27
Choose Your Own Adventure
How would you like to proceed?
Advanced R visualizations!
Data stories in a business/
non-profit contextCreative data products
A secret 4th thing!
Econ 255 - Data Storytelling