What is Data Storytelling?
285,474
persons in poverty in San Bernardino County in 2019
285,474
persons in poverty in San Bernardino County in 2019
What is missing?
Agenda
1
Introductions and Overview
2
Example and critique
3
Wrap-up
Course Website
Introductions and Course Overview
About me
Prof. Cline, Dr. Cline, or Nate
- Born and raised in MD just outside of DC
- PhD in Economics from the University of Utah
- Research interests in macroeconomics, international political economy, and childcare
- In my spare time I make furniture with handtools!
Contact and office hours
(or drop by my office T, Th 3pm - 4pm)
Office: Duke 201
About you
- Preferred name
- Major/emphasis/interest
- Song/artist/music style I should add to the class playlist
Course FAQ
What is data storytelling?
Data storytelling blends skills from design, communication, creative writing, data science, visual arts, and more to explore data and communicate insights.
Do I have to know programming/data science/statistics/etc…?
This course assumes you’ve been through a statistics course and had the equivalent of econ 101. In both cases we will review the material we need, but life will be much easier if you’ve seen it before. This course assumes no prior programming experience
Course FAQ
How do I get an A?
This is a project based course, so in addition to doing the usual stuff (coming to class, handing in short assignments), you’ll get an “A” by getting really really into your project!
Is this an economics course?
Not a traditional one!
Where our class lives
Course Website
Teams
?
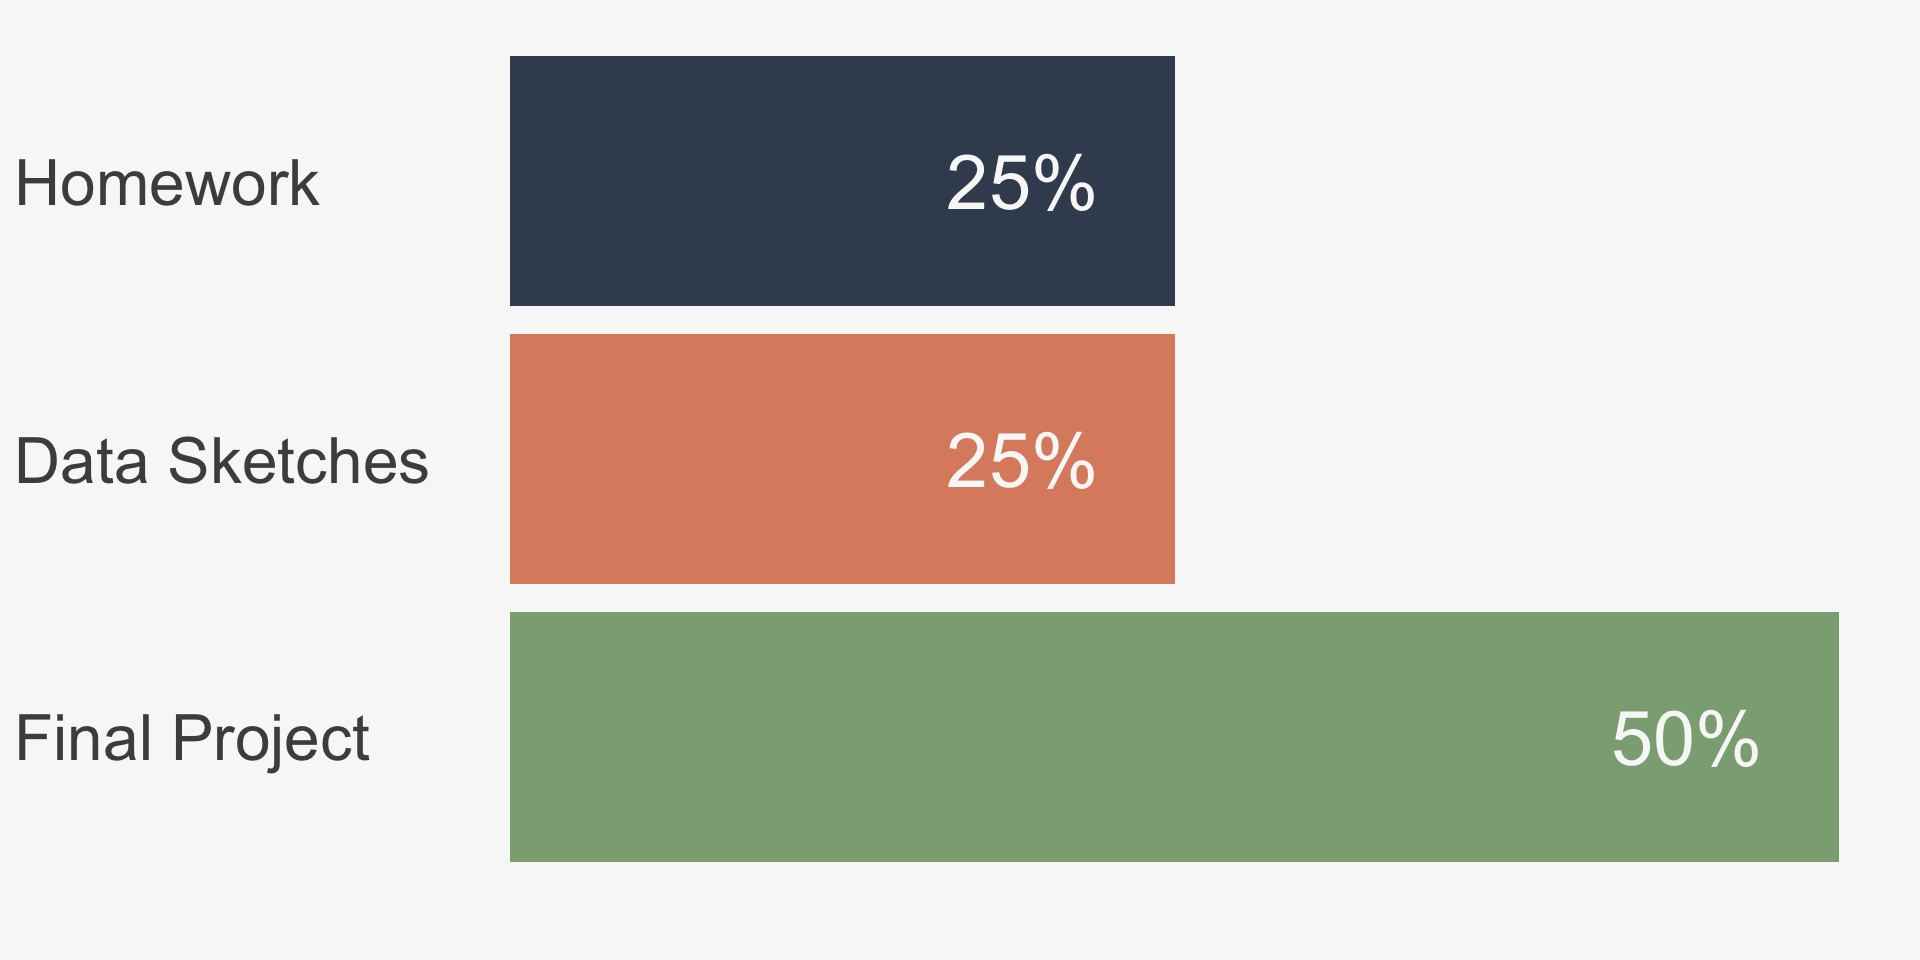
Grading
We will learn
- to critically appreciate the data narratives we come across daily
- creative methods and media for communicating data in a truthful, insightful and beautiful way.
We will use the programming language and in particular a cloud based version in positCloud.
Data and the American Dream
This course is framed around the “American dream.”
All of our data sets will somehow relate to this theme.
But… What is the American Dream?
Course outline
Fundamentals
Examples
R and graphic design
Finding data
Exploring data
Racial wealth gaps
The toolbelt of techniques
Core Tools
Grammar of graphics
Amounts and proportions
Themes
Uncertainty
Relationships
Comparisons
Time
Special Topics
Mapping
Text-based data
Creative and interactive graphs
Enhancing graphics
Data Sculptures
Participatory data games
Plus special guests and field trips!
Final Project
in teams of 3(-ish)
- Insightful, data-based story with a clear connection to the “American Dream” broadly interpreted
- Presentation of that story with a well defined audience and goals
- Methodology write up
- Audience assessment tool
- Presentation of the project to our class
Example and critique
Hans Rosling and life expectancy
Rosling Discussion
- What data sets are used?
- How are the data presented?
- What is the core story the infographic is trying to tell?
- What works to tell this story and what doesn’t? Should anything be added or removed?
Wrap-up
Review
1
Introductions and Overview
2
Example and critique
To Do
Read
- Chapter 1 in Data Visualization by Kieran Healy
- Chapters 2 and 3 in The Truthful Art by Alberto Cairo (course reserves on Teams)
Do
- Find a data visualization that grabs you (either positively or negatively) and post it with a short summary on our Teams site.
Econ 255 - Data Storytelling